Output.link_series
- Output.link_series(link, attribute=('flow_rate', 'flow_velocity', 'flow_depth'), start=None, end=None, columns='attr', asframe=True)[source]
Get one or more time series for one or more link attributes. Specify series start index and end index to get desired time range.
- Parameters:
- link: Union[int, str, Sequence[Union[int, str]], None]
The link index or name.
- attribute: int | str | EnumMeta | Sequence[int | str | EnumMeta] | None
The attribute index or name.
On of:
flow_rate, flow_depth, flow_velocity, flow_volume, capacity.
defaults to: (‘flow_rate’,’flow_velocity’,’flow_depth’)
Can also input the integer index of the attribute you would like to pull or the actual enum from output.link_attributes.
Setting to None indicates all attributes.
- start_index: Union[str,int, datetime, None], optional
The start datetime or index of from which to return series, defaults to None.
Setting to None indicates simulation start.
- end_index: Union[str,int, datetime, None], optional
The end datetime or index of from which to return series, defaults to None.
Setting to None indicates simulation end.
- columns: Optional[str], optional
Decide whether or not to break out elements or attributes as columns. May be one of:
None: Return long-form data with one column for each data point
‘elem’: Return data with a column for each element. If more than one attribute are given, attribute names are added to the index.
‘attr’: Return data with a column for each attribute. If more than one element are given, element names are added to the index.
defaults to ‘attr’.
- asframe: bool
A switch to return an indexed DataFrame. Set to False to get an array of values only, defaults to True.
- Returns:
- Union[pd.DataFrame,np.ndarray]
A DataFrame or ndarray of attribute values in each column for requested date range and links.
Examples
Pull flow rate for two conduits
>>> from swmm.pandas import Output,example_out_path
>>> out = Output(example_out_path)
>>> out.link_series(['COND1','COND6'],out.link_attributes.FLOW_RATE,columns='elem')
                        COND1   COND6
datetime
1900-01-01 00:05:00  0.000031  0.0000
1900-01-01 00:10:00  0.000280  0.0000
1900-01-01 00:15:00  0.000820  0.0000
1900-01-01 00:20:00  0.001660  0.0000
1900-01-01 00:25:00  0.002694  0.0000
...                       ...     ...
1900-01-01 23:40:00  0.037800  1.5028
1900-01-01 23:45:00  0.037800  1.5028
1900-01-01 23:50:00  0.037800  1.5028
1900-01-01 23:55:00  0.037800  1.5028
1900-01-02 00:00:00  0.037800  1.5028
[288 rows x 2 columns]
Pull a wide-form dataframe for all parameters for a link
>>> out.node_series('COND1', out.link_attributes)
                     flow_rate  flow_depth  ...  pol_rainfall        sewage
datetime                                    ...
1900-01-01 00:05:00   0.000031    0.053857  ...      0.000000  0.000000e+00
1900-01-01 00:10:00   0.000280    0.134876  ...      0.000000  0.000000e+00
1900-01-01 00:15:00   0.000820    0.165356  ...      0.000000  0.000000e+00
1900-01-01 00:20:00   0.001660    0.188868  ...      0.000000  0.000000e+00
1900-01-01 00:25:00   0.002694    0.206378  ...      0.000000  0.000000e+00
...                        ...         ...  ...           ...           ...
1900-01-01 23:40:00   0.037800    0.312581  ...     68.344780  6.173063e-08
1900-01-01 23:45:00   0.037800    0.312581  ...     68.242958  5.872794e-08
1900-01-01 23:50:00   0.037800    0.312581  ...     68.144737  5.583060e-08
1900-01-01 23:55:00   0.037800    0.312581  ...     68.052620  5.311425e-08
1900-01-02 00:00:00   0.037800    0.312581  ...     67.963829  5.049533e-08
[288 rows x 8 columns]
Pull a long-form dataframe of all links and attributes
>>> out.link_series(out.links, out.link_attributes, columns=None)
                                          result
datetime            element attribute
1900-01-01 00:05:00 COND1   flow_rate   0.000031
1900-01-01 00:10:00 COND1   flow_rate   0.000280
1900-01-01 00:15:00 COND1   flow_rate   0.000820
1900-01-01 00:20:00 COND1   flow_rate   0.001660
1900-01-01 00:25:00 COND1   flow_rate   0.002694
...                                          ...
1900-01-01 23:40:00 WR1     sewage     45.430920
1900-01-01 23:45:00 WR1     sewage     45.430920
1900-01-01 23:50:00 WR1     sewage     45.430920
1900-01-01 23:55:00 WR1     sewage     45.430920
1900-01-02 00:00:00 WR1     sewage     45.430920
[18432 rows x 1 columns]
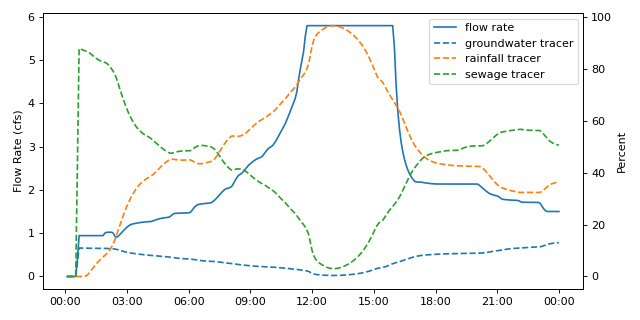
Pull flow timeseries and pollutant tracer concentrations for a link and plot
import matplotlib.pyplot as plt
import matplotlib.dates as mdates
from swmm.pandas import Output,example_out_path

out = Output(example_out_path)
df = out.link_series('COND6',['flow_rate','groundwater','pol_rainfall','sewage'])

# set up figure
fig,ax = plt.subplots(figsize=(8,4))

# plot flow rate on primary yaxis
ax.plot(df.flow_rate,label="flow rate")

# plot pollutant concentrations on secondary axis
# rainfall, DWF, and groundwater were given 100 mg/L pollutant
# concentrations to serve as tracers
ax1 = ax.twinx()
ax1.plot(df.groundwater,ls = '--',label="groundwater tracer")
ax1.plot(df.pol_rainfall,ls = '--',label="rainfall tracer")
ax1.plot(df.sewage,ls = '--',label="sewage tracer")

# style axes
ax.set_ylabel("Flow Rate (cfs)")
ax.xaxis.set_major_formatter(mdates.DateFormatter("%H:%M"))
ax1.set_ylabel("Percent")

# add legend and show figure
fig.legend(bbox_to_anchor=(1,1),bbox_transform=ax.transAxes)
fig.tight_layout()

fig.show()